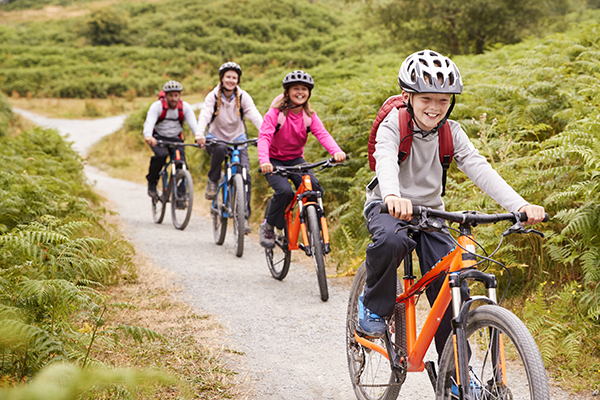
After years of declining bike riding participation numbers, 2021 has proven to be a year of change with an increase of 9% across Australia.

About The Survey
The Cycling Participation Survey is a bi-annual report that shows cycling trends across Australia. In 2021, they added walking into the survey in order to gather more information on active transport as a whole.
Impact of COVID-19
With the steady downward trend of cycling participation numbers over the last decade, COVID-19 has proved to have a circuit breaker effect.
The pandemic put a stop to community sport and limited people to local exercise, making bike riding a great physical activity option. Nationally, the weekly participation rate increased from 13.8% in 2019 to 18.2% in 2021 and on an annual basis this went from 35% in 2019 to 44.3% in 2021.
Age and Gender
Across Australia, there was a 7% increase in males and a 3% increase in females cycling in the past year. Men still firmly ahead of female participation rate by almost 12% - 46% to 34.3% respectively.
Interestingly, the 30 - 49 age group had the largest jump in participation from 34.6% to 40.7%. With the lowest age group being 50+ are just 21%. With the ongoing benefits of cycling in the later stages of life, there is potential for more seniors to gain the mental and physical health benefits of cycling. The highest cycling participation rate based on yearly usage is 10-17 with 73.9%.
Boys aged between 10-17 have the highest participation rate out of all ages and genders with 80.8% having ridden once in the past year.
State By State Comparisons
Over the last year 44.3% of the population have ridden a bike at least once but let’s break it down.
Northern Territory has the highest participation numbers with: 21.7% weekly riding a bike, 33.7% monthly riding a bike and 49.6% annually riding a bike.
Unfortunately, NSW has the lowest cycling participation numbers across Australia at just: 12.9% weekly riding a bike, 19.6% monthly riding a bike and 32.8% annually riding a bike.
In terms of capital cities Darwin had the highest annual participation rate with 51%, followed by Hobart and Perth tied at 45.7%, then Brisbane with 43%, Melbourne with 41.2%, Adelaide with 37.8% and Sydney with 35.7%.
NSW Figures
Excitingly, NSW participation numbers rose over the last 2 years and it has been great to see more people riding across the state.
In 2021, 15.4% of residents rode a bike once a week compared to 12.9% in 2019. Looking at this annually it rose from 32.8% in 2019 to 36% in 2021. Among those who had ridden in the past year 18% indicated that they were riding more, compared to the previous year.
Of the people who cycled in NSW in the last month, 90.7% cycled for recreation and 27.7% for transport.
Sydney’s participation numbers have risen by almost 8% in the last two years which can probably be put down to the COVID-19 impact and the pop-up cycleways.
“Bicycle NSW is pleased to see that participation rates for bike riding in NSW are increasing,” said Bicycle NSW General Manager of Public Affairs, Bastien Wallace.
“We know there’s a long way to go to achieve the mode shift we need to increase health and reduce congestion, but pop-ups have confirmed what works, we just need more,” said Bastien.
We encourage everyone to keep on cycling, if you need any resources or tips on where to ride visit our information hub here.

