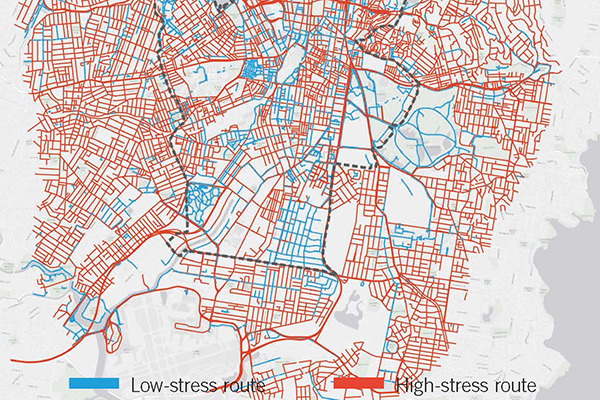
A recent audit of the City of Sydney has shown the improvement in bike infrastructure over the last year, mostly thanks to the pop-up cycleways.
These 6 new pop-ups helped boost CoS score from a 38 to 43 (out of 100) for bikeability.

Bicycle Network Analysis
The Bicycle Network Analysis (BNA) measures how well bike infrastructure is connected to where people want to go i.e. shops, sport, doctors, work etc. The map divides locations into low and high stress biking connections.
There are four steps to score a bicycle network:
- Data collection
- Traffic Stress Analysis
- Destination Analysis
- Score Aggregation
Global BNA
Sitting in the top spots globally for cities that have been analysed are Knokke (Belgium) at 87, Antwerp (Belgium) at 84 and Alma (USA) at 81. These cities have great connectivity of their cycling infrastructure to enable people to feel safe when riding to amenities.
Comparatively in Australia:
- Adelaide’s inner city scored 39
- Brisbane’s inner city scored 38
- Canberra scored 61
- Darwin’s inner city scored 34
- Hobart’s inner city scored 28
- Melbourne’s inner city scored 45
- Perth’s inner city scored 40
We Ride is rolling out the program in Australia and has undertaken the analysis of the above popular council areas in capital cities. Over the next year, they will be rolling out the analysis to further LGA and encourage everyone interested to contact them at email peter@weride.org.au
“It’s great to see the impact the pop-up cycleways are having on the bikeability of Sydney’s inner city,” said Kim Lavender, Bicycle NSW Communications Manager.
“We encourage the Government and all councils to continue building connected bicycle infrastructure to enable more people to feel safe when riding their bikes,” said Kim.
If you would like your LGA to undergo a Bicycle Network Analysis, why not share this article with them?
Safety On Spokes
This article is a part of our 2 month Safety on Spokes Campaign where we cover a range of topics to make a better environment for bike riders in NSW.

